Better Express error
Better-express-error
When developing with Express, encountering an error usually means it gets printed directly onto an error page, or redirected to a 404/500 page in production.
While there’s nothing out of the ordinary about that, honestly, does seeing a page like this make you happy?
Engineers familiar with Ruby on Rails development have probably used better_errors or Rails’ built-in error trace page for debugging.
In Express, however, I haven’t seen a package with functionality similar to better_errors. Too often, we’re left groaning at hideous error messages like this.
So, I built a simple middleware to handle this. Essentially, it’s an Express implementation of better_errors.
Analyzing the Error Message
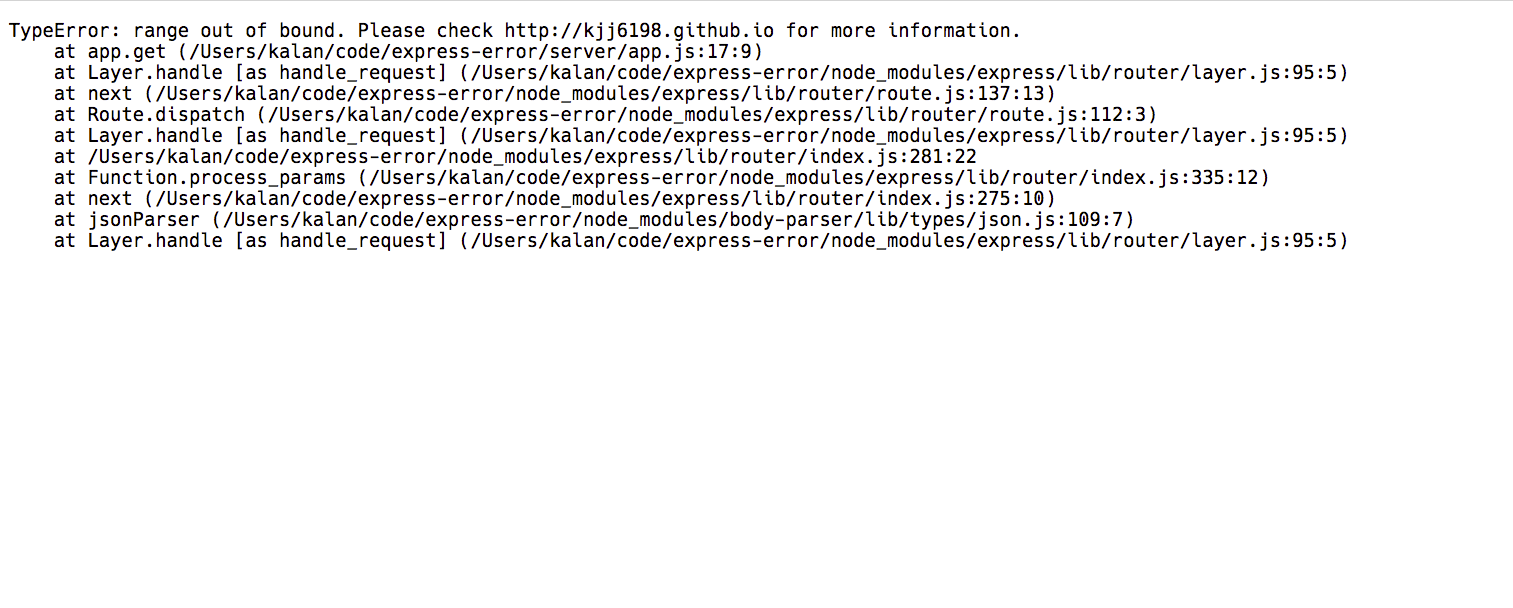
TypeError: range out of bound. Please check http://kjj6198.github.io for more information.
at app.get (/Users/kalan/code/express-error/server/app.js:17:9)
at Layer.handle [as handle_request] (/Users/kalan/code/express-error/node_modules/express/lib/router/layer.js:95:5)
at next (/Users/kalan/code/express-error/node_modules/express/lib/router/route.js:137:13)
at Route.dispatch (/Users/kalan/code/express-error/node_modules/express/lib/router/route.js:112:3)
at Layer.handle [as handle_request] (/Users/kalan/code/express-error/node_modules/express/lib/router/layer.js:95:5)
at /Users/kalan/code/express-error/node_modules/express/lib/router/index.js:281:22
at Function.process_params (/Users/kalan/code/express-error/node_modules/express/lib/router/index.js:335:12)
at next (/Users/kalan/code/express-error/node_modules/express/lib/router/index.js:275:10)
at jsonParser (/Users/kalan/code/express-error/node_modules/body-parser/lib/types/json.js:109:7)
at Layer.handle [as handle_request] (/Users/kalan/code/express-error/node_modules/express/lib/router/layer.js:95:5)
If you examine it closely, you’ll notice that error messages follow a very neat and consistent format. First, the first line contains the error name and message, which is usually the most critical piece of information. Subsequent lines form the call stack. Lines starting with at … represent function calls, with the filename, line number, and column info enclosed in parentheses.
After breaking down the error message, we can convert this plain text into more useful information. By using split('\n') and running a simple regular expression on the strings, we can extract the filename and line number details.
Displaying the Error
The first line of an error message is usually the most important piece of information because that’s where the code blew up. Therefore, we place this first line in the most prominent spot and highlight it.

For the stack trace starting from the second line, we use different colors and font sizes to highlight filenames, line numbers, and invoked function names.
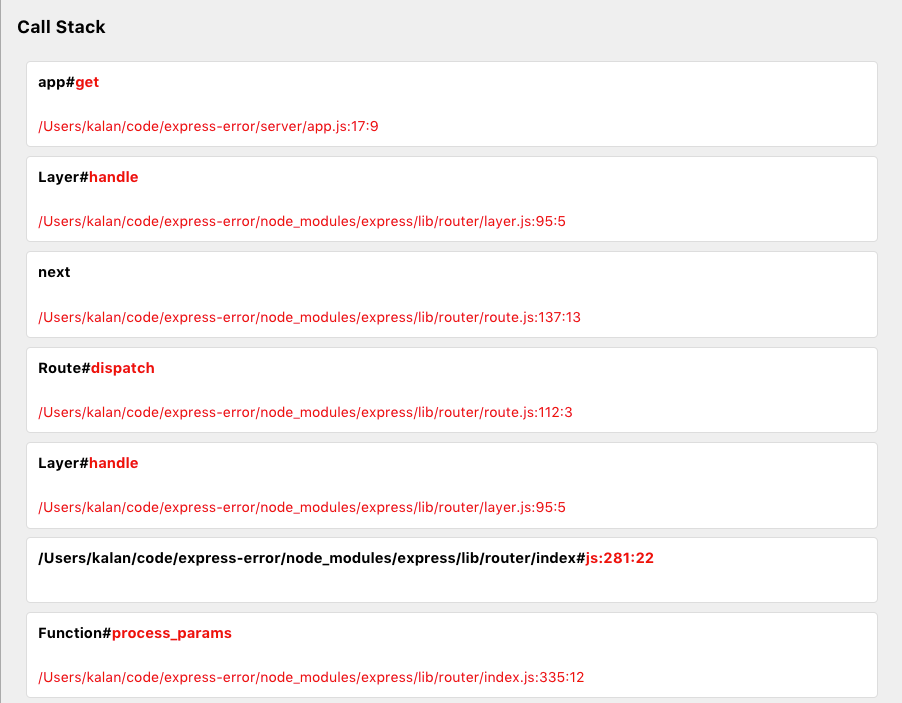
Compared to the previous wall of plain text, this simple organization lets developers understand what went wrong at a glance.
Displaying File Contents
Beyond just displaying the error message, we also want to show the corresponding file contents and the surrounding context. Thus, on the right side, we can use the filename and line number extracted from the error message to display the relevant code.
In Node.js, fs.readFileSync is all we need.
function(filename, line, row) {
  const content = fs.readFileSync(filename);
  content.toString()
  	.split('\n')
  	.slice(line - 5, line + 5)
  	.map(content => `<span>${content}</span>`)
  	.join('\n');
}
Here, we take a straightforward approach by printing the 5 lines before and after the error. A smarter way would be to use techniques like AST parsing to display just the relevant function body. But for now, showing 5 lines before and after is good enough.
With some tweaks and adjustments, it looks something like this:
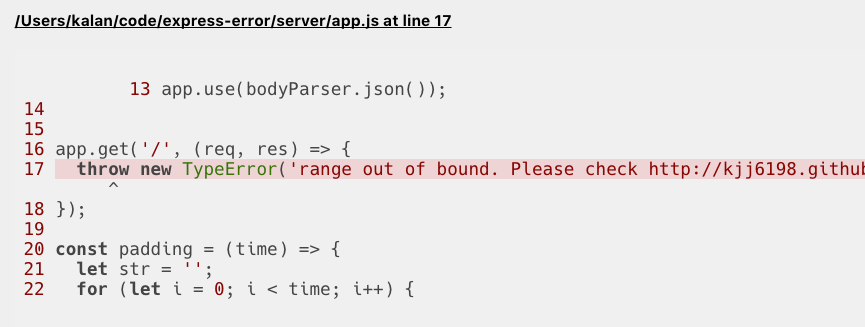
With simple syntax highlighting, developers can instantly spot where things went wrong.
REPL
In addition to displaying errors, we also want this page to allow typing in small snippets of code to verify issues before making actual code changes.
Node.js provides a vm module that allows you to execute code within V8 Virtual Machine contexts. With this module, we can implement REPL-like functionality!
const debugContext = vm.createContext({
  request: req,
  response: res,
  util: require("util"),
  Buffer: require("buffer").Buffer,
  stream: require("stream"),
  console: {
    log: util.format,
  },
  clear: "",
})
By passing the variables we want to expose into the context and reading frontend-submitted code via POST requests, we can easily achieve a powerful debugging experience.
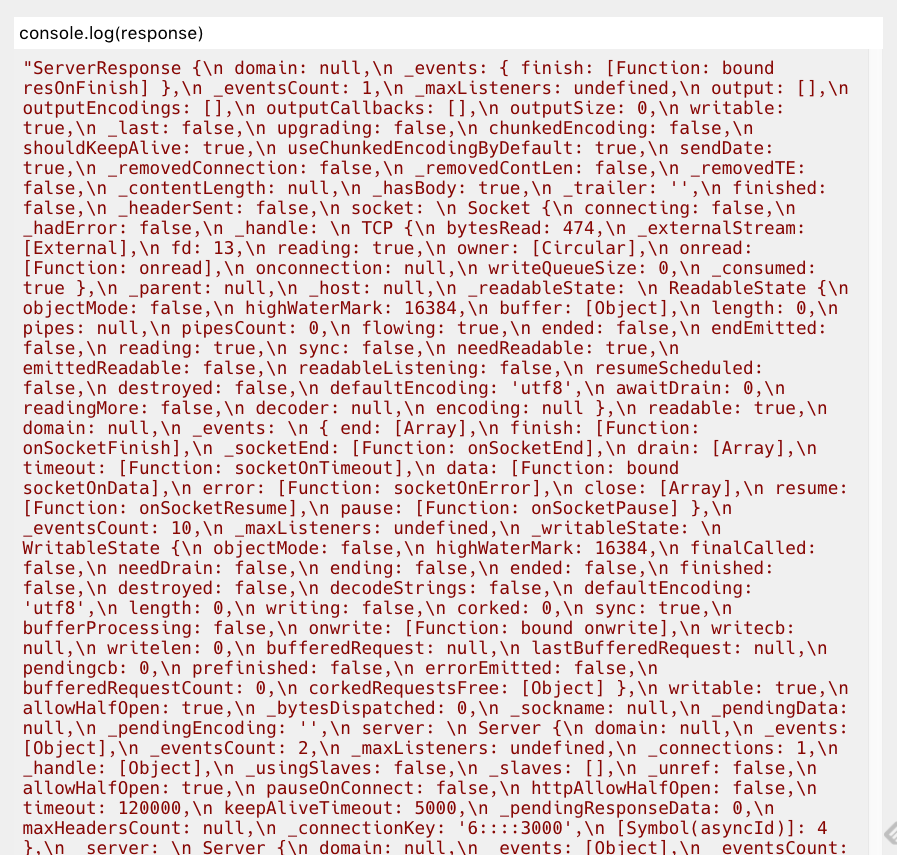
(The above still needs a few adjustments)
Putting It All Together!
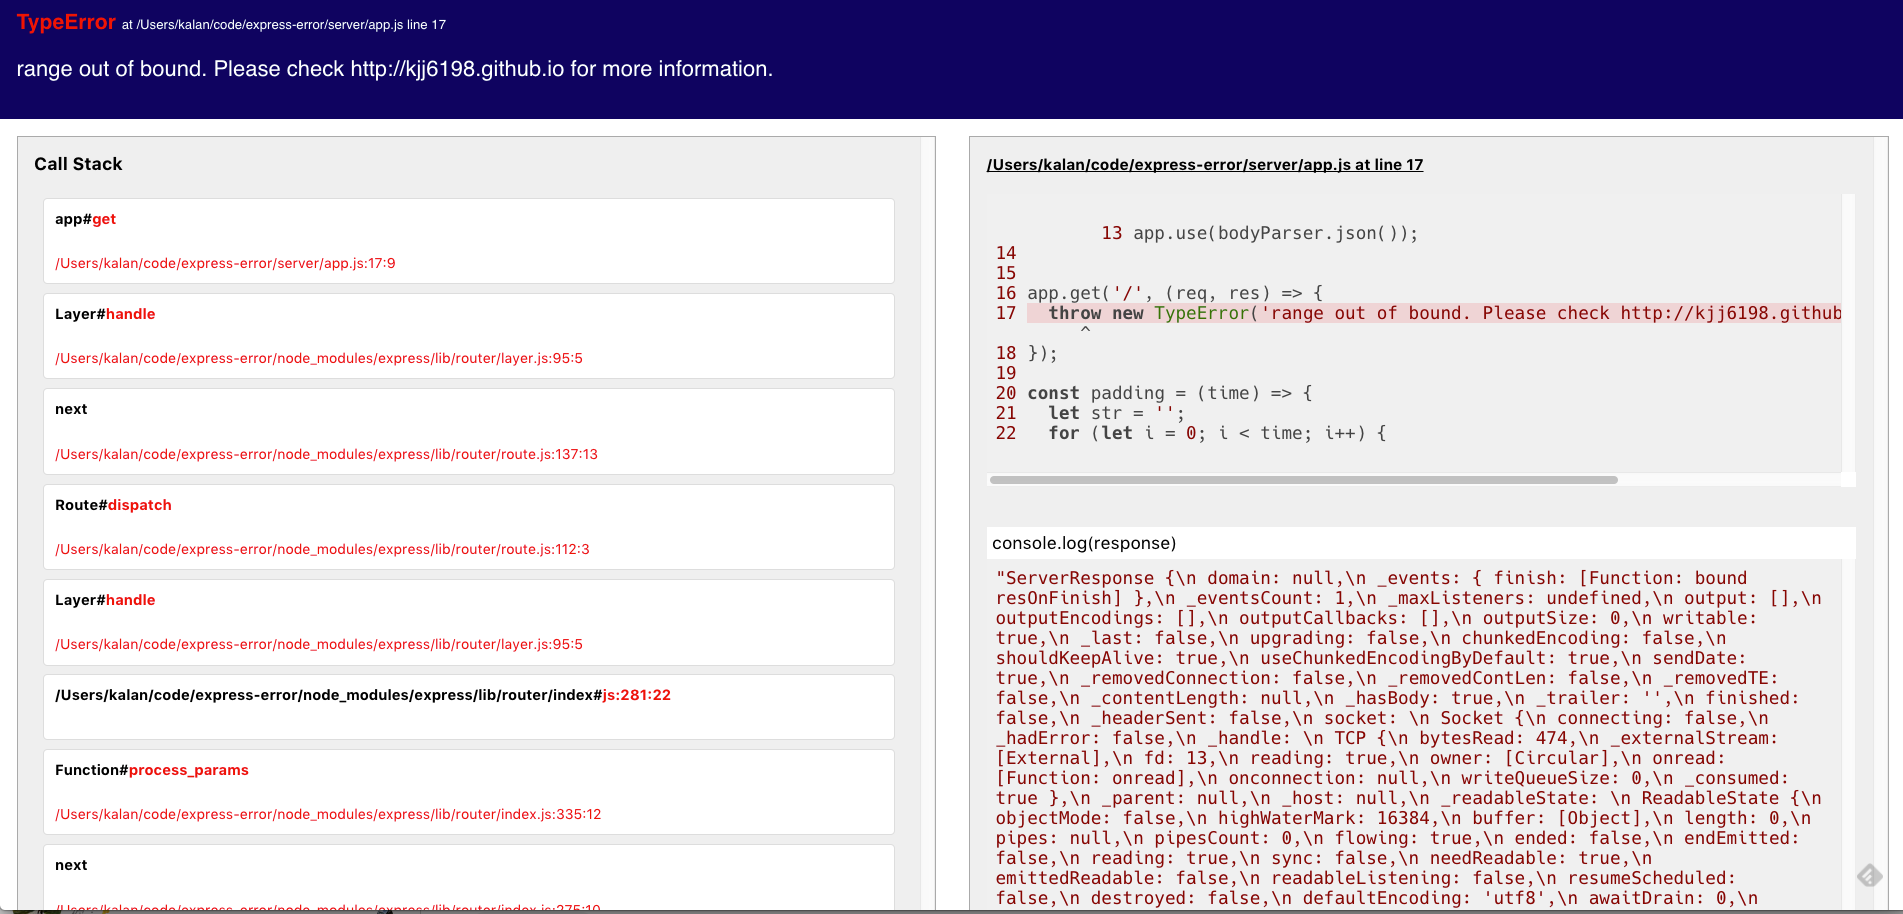
Once everything is integrated, the page looks roughly like this.
Compared to the original plain text, while it took some effort to polish the page style and implement REPL capabilities, it makes the debugging workflow much smoother.
Conclusion
The detailed implementation can be found in this repo. When I have some free time, I’ll extract it into a standalone middleware package for easier use. I’ll also gradually refine the layout, code highlighting, and overall UX. Though who knows when that will be XD
Feedback and suggestions via issues are always welcome!
Related Posts
- When a Measure Becomes a Target: From the Window Tax to Pull Request Counts I once wrote a script to tally how many PRs I contributed in a quarter, how many reviews I left, and how many tickets I closed, hoping to use numbers to prove my output to my manager. My manager simply remarked that performance isn't just about output. Years later, I finally understood—when a measure becomes a target, it ceases to be a good measure. From the British window tax and the Hanoi rat bounty to evaluating developers by PR counts today, the underlying mechanism is exactly the same.
- Using Cloudflare Images for Image Storage and Transformation Putting an image on a webpage is the simplest task in frontend development. But doing it properly—including resizing, generating multiple formats, and withstanding heavy traffic—is actually an entire end-to-end solution. Eventually, I offloaded everything to Cloudflare Images, keeping only a single original image.
- Stop Using AWS Access Keys Access Keys are an easily overlooked security risk in AWS. By pairing OIDC with IAM Roles, GitHub Actions can securely operate AWS resources without storing any secrets.
- Database Primary Keys: AUTO_INCREMENT, UUID, and UUIDv7 Backend developers often face the choice of primary keys: should you use auto-increment or UUID? What about collisions? How does UUIDv7 compare to created_at + index in performance? Here are the design decisions and benchmark results from testing 20 million rows.