Better-express-error
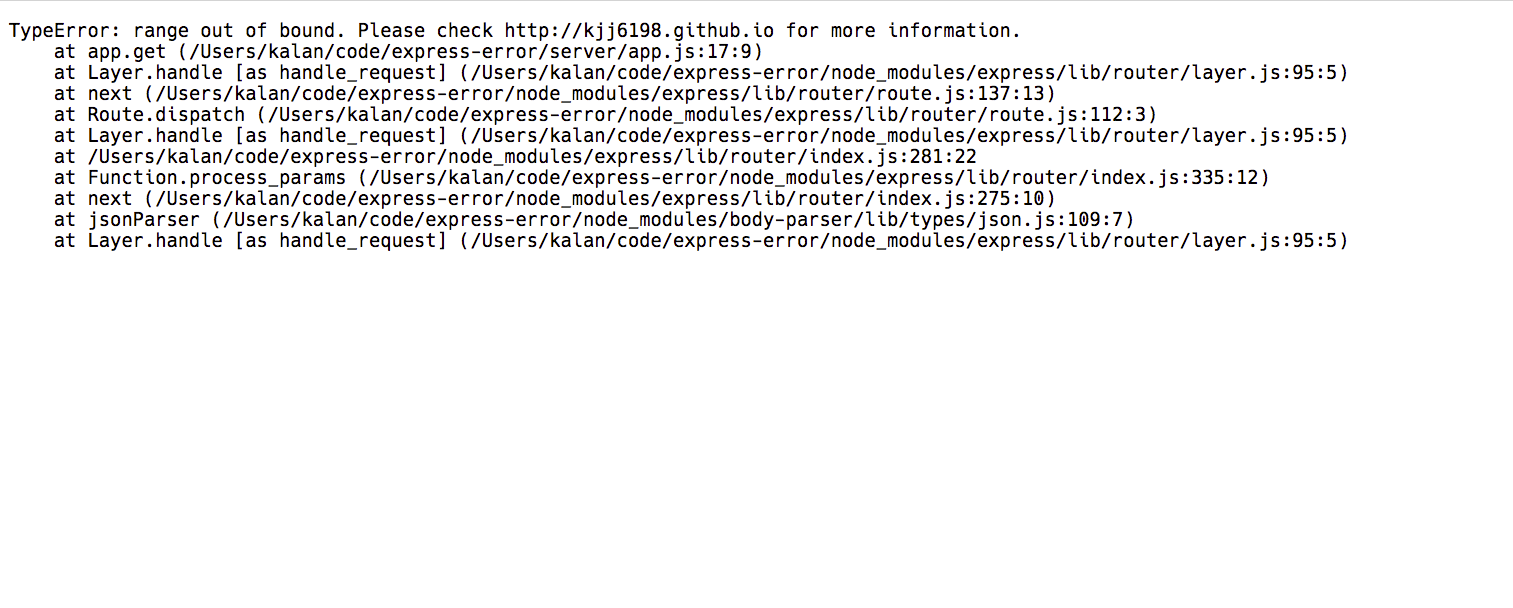
When developing with express, if an error occurs, it is usually directly printed on the error page or redirected to a 404 or 500 page in production.
Although this may not be worth mentioning, honestly, do you feel happy when you see these kinds of pages?
Engineers familiar with Ruby on Rails development should have used better_errors or the built-in error trace page in Rails itself for debugging.
However, in express, I haven't seen a package similar to better_errors that provides such functionality. Often, we can only see these ugly error messages and feel frustrated.
So, I created a simple middleware to handle this. Essentially, it's an express implementation of better_errors.
Analyzing error messages
TypeError: range out of bound. Please check http://kjj6198.github.io for more information.
at app.get (/Users/kalan/code/express-error/server/app.js:17:9)
at Layer.handle [as handle_request] (/Users/kalan/code/express-error/node_modules/express/lib/router/layer.js:95:5)
at next (/Users/kalan/code/express-error/node_modules/express/lib/router/route.js:137:13)
at Route.dispatch (/Users/kalan/code/express-error/node_modules/express/lib/router/route.js:112:3)
at Layer.handle [as handle_request] (/Users/kalan/code/express-error/node_modules/express/lib/router/layer.js:95:5)
at /Users/kalan/code/express-error/node_modules/express/lib/router/index.js:281:22
at Function.process_params (/Users/kalan/code/express-error/node_modules/express/lib/router/index.js:335:12)
at next (/Users/kalan/code/express-error/node_modules/express/lib/router/index.js:275:10)
at jsonParser (/Users/kalan/code/express-error/node_modules/body-parser/lib/types/json.js:109:7)
at Layer.handle [as handle_request] (/Users/kalan/code/express-error/node_modules/express/lib/router/layer.js:95:5)
After careful observation, it can be noticed that the format of the error message is quite consistent. First, the first line contains the error name and message, which is usually the most important information. The following lines are the stack trace. "at ..." denotes a function call, and the parentheses contain the filename, line number, and row information.
After analyzing the error message, we can convert the plain text into more useful information. By using split('\n') and simple regular expression matching based on strings, we can extract the filename and line number information.
Displaying the Error
For the first line of the error message, which is usually the most important information since it indicates where the code went wrong, we highlight it and place it in the most prominent position.

For the subsequent lines of the error message, we use colors and font sizes to indicate the filename, line number, and the invoked function.
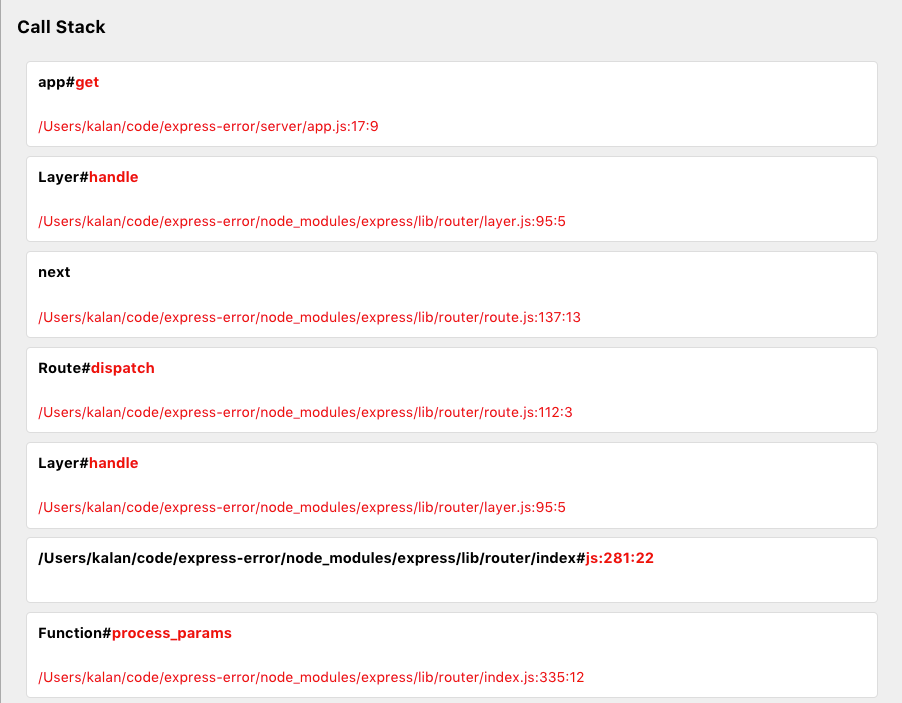
Compared to the previous block of plain text, this simple organization already allows developers to quickly understand what went wrong.
Displaying File Contents
However, in addition to displaying the error message, it would be helpful to also show the corresponding file contents and the surrounding context. Therefore, on the right side, we can use the filename and line number provided in the error message to display the corresponding file contents.
For Node.js, it is sufficient to use fs.readFileSync.
function(filename, line, row) {
  const content = fs.readFileSync(filename);
  content.toString()
  	.split('\n')
  	.slice(line - 5, line + 5)
  	.map(content => `<span>${content}</span>`)
  	.join('\n');
}
Here, we simply print the five lines before and after the error line. A smarter approach would be to only print the content of the corresponding function using techniques like AST. However, for now, printing the surrounding code is sufficient.
After some adjustments and modifications, it would look something like this:
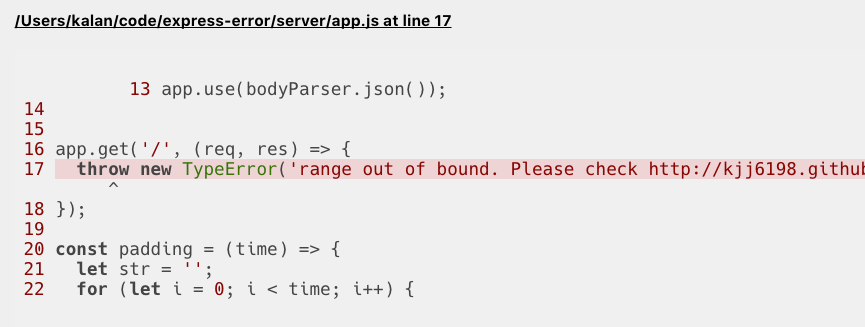
By highlighting the code, developers can immediately identify where the error occurred.
REPL
In addition to displaying the error, we also want this page to allow input of simple code so that we can confirm the problematic areas and make actual code modifications.
In Node.js, there is a VM module that allows you to execute given code using V8's Virtual Machine contexts. With this module, we can achieve functionality similar to a REPL!
const debugContext = vm.createContext({
  request: req,
  response: res,
  util: require("util"),
  Buffer: require("buffer").Buffer,
  stream: require("stream"),
  console: {
    log: util.format,
  },
  clear: "",
})
By passing the variables we want to expose into the context and then reading the frontend code through a POST request, we can easily achieve the debugging effect.
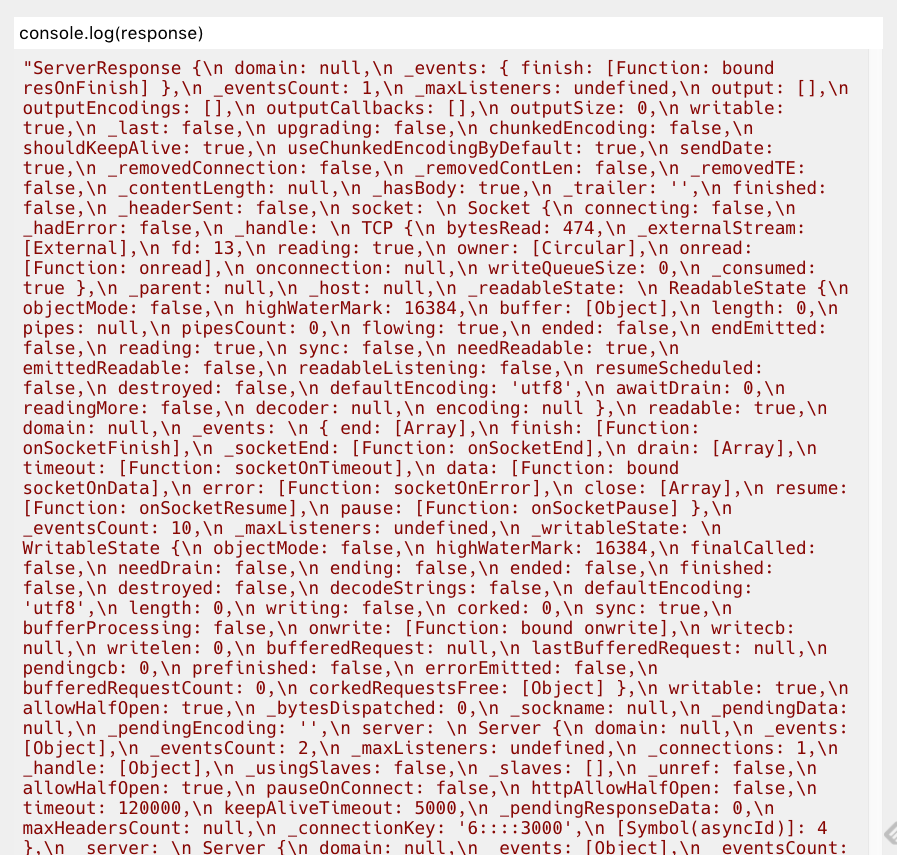
(Some adjustments are still needed)
All Integrated!
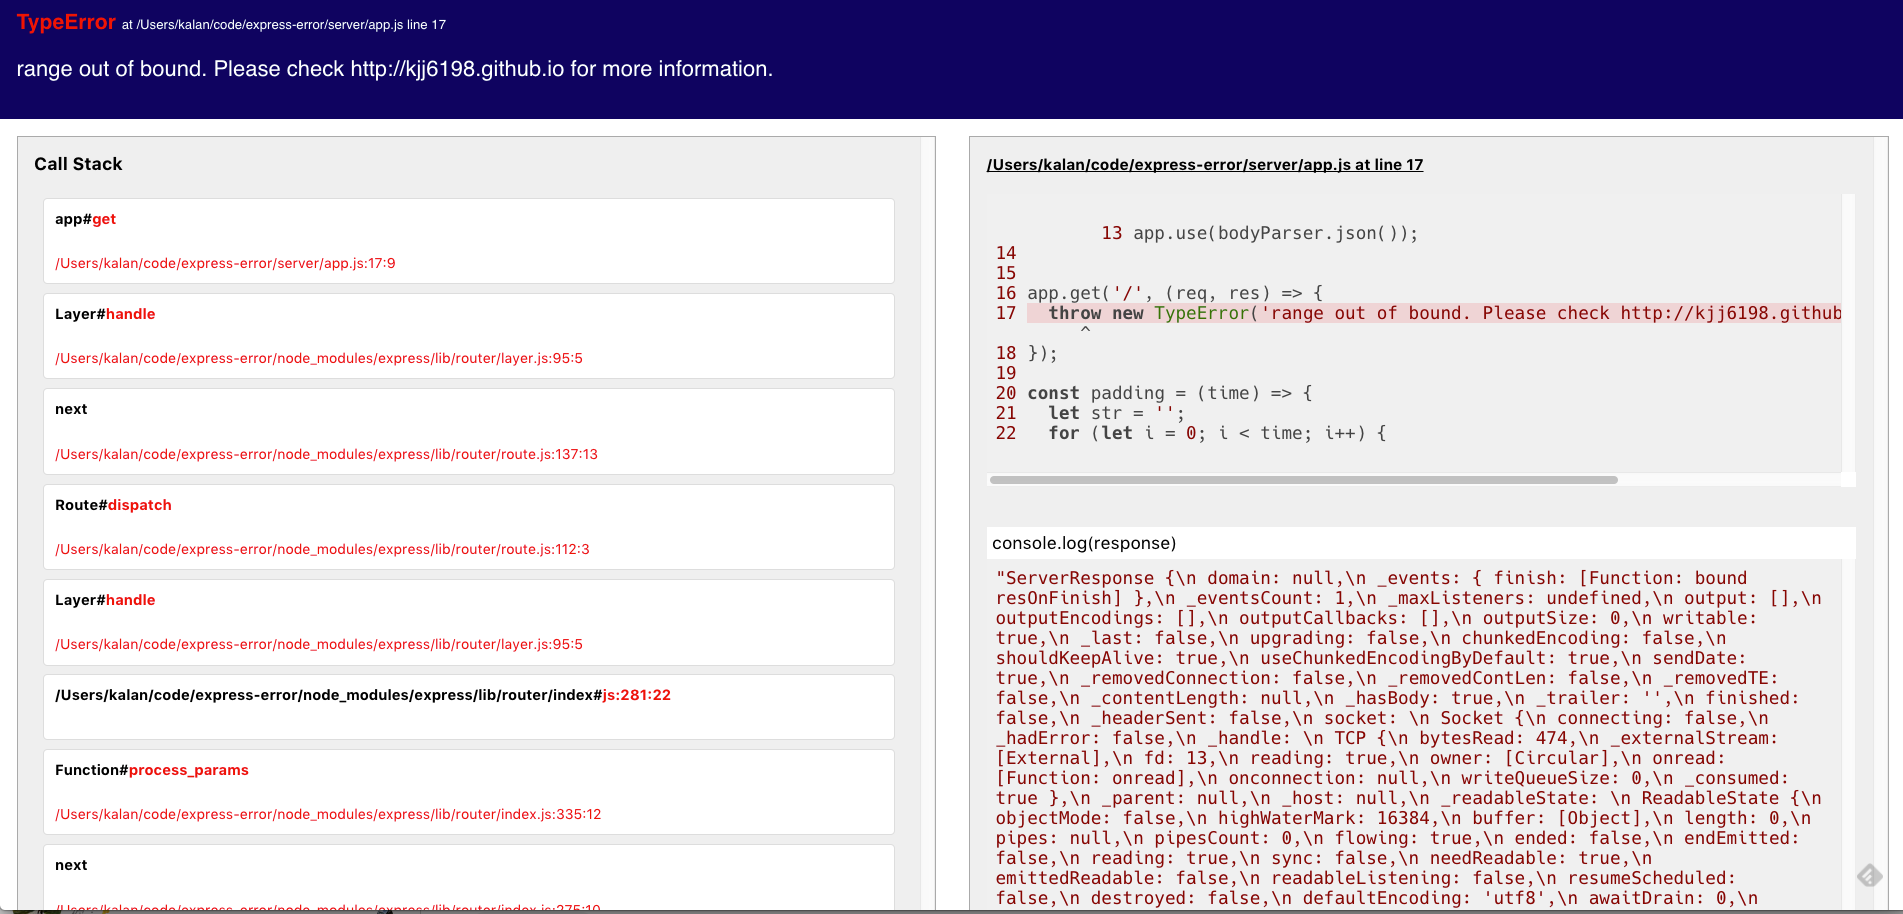
After integrating everything, the page would look something like this.
Compared to the original plain text, although it took some effort to adjust the page style and implement the REPL functionality, it makes the debugging process much smoother.
Conclusion
The detailed implementation can be found in this repository. If I have some free time in the near future, I will refactor the implementation into a middleware form for easier usage. I will also gradually optimize the overall layout and code highlighting, making the entire process and interface smoother. However, I can't say how long it will take XD
If you have any suggestions, feel free to open an issue.