
If you have any questions or feedback, pleasefill out this form
This post is translated by ChatGPT and originally written in Mandarin, so there may be some inaccuracies or mistakes.
Introduction
Recently, I've really enjoyed exploring various IoT applications, purchasing a lot of Arduino boards and different sensors. I currently have an Arduino Uno, Arduino Mega2560, and 3 Arduino Nanos. I thought I might spend some time experimenting to see if I could create some interesting applications while taking the opportunity to review some high school electronics and hardware operations.
Coincidentally, my company organized an internal hackathon with minimal restrictions on themes, so I decided to implement an application I've been wanting to work on for a while: an "Air Quality Monitor." Although it focuses on air quality, the implementation currently only monitors carbon dioxide concentration and temperature/humidity. However, if I had additional sensors, it wouldn’t be too difficult to incorporate them as well.
The main reason behind this idea is that carbon dioxide levels can significantly impact human cognition and productivity. I'm sure many of you have experienced that moment in a meeting room when you suddenly feel dizzy or your thoughts become muddled. It's highly likely that elevated carbon dioxide levels are to blame. In poorly ventilated, enclosed spaces, carbon dioxide concentration can rise quickly, exceeding 2000 ppm within just a few minutes.
Beyond the implementation itself, I really dislike the feeling of just putting together a kit and calling it done, so I aim to delve a bit deeper into the details and avoid that sense of "I finished the kit, but I have no idea what happened." (Although I still used kits for the implementation, at least I feel a bit more justified about it XD)
This series of articles will cover the following topics:
- Sensor Introduction - DHT11 and MH-Z14A
- Data Communication - UART
- Arduino Troubleshooting: Discussing problems encountered during implementation; often, it's not a bug but a lack of familiarity with Arduino and hardware
- WiFi: To save debugging time, I purchased an ESP32 development board, which already includes WiFi and Bluetooth capabilities.
- MQTT: To transmit data to other devices, I used MQTT, a lightweight communication protocol.
- Grafana / Web: Since the data is stored in a database, it should be displayed in a visually appealing way! Here, I used Grafana + Prometheus and Svelte to visualize the data.
Architecture
For convenience, the architecture looks something like this:

-
The Arduino Uno sends commands to the CO2 sensor, which returns data to the Arduino. The two communicate via UART.
-
The Arduino Uno sends CO2 data to the ESP32 (also via UART).
-
Temperature and humidity data is obtained from the DHT11 and sent to the ESP32.
-
The ESP32 transmits temperature, humidity, and CO2 data via WiFi to the MQTT Broker.
-
There are two applications that subscribe to events: the analysis server and the app server.
- The analysis server is responsible for sending data to Prometheus, which is then visualized by Grafana.
- The app server receives the data, stores it in the database, and provides APIs for external use.
-
If carbon dioxide levels exceed a certain concentration, a Slack notification is sent.
Overall, this is how it works. Next, let’s address some potential questions:
1. Why use an Arduino Uno in addition to the ESP32? Doesn't it seem like the ESP32 could handle everything?
The initial thought was to use the ESP32 as an intermediary to keep the overall architecture clean. However, after completing the implementation, it seems unnecessary. One thing to note is that some libraries built into Arduino are not available on the ESP32, such as SoftwareSerial (a library that allows you to use digital pins as tx and rx). Without this library, we can only use the built-in HardwareSerial, which limits us to a single UART communication.
Another reason is that it looks cooler to have an Arduino in the setup; it's just not as stylish without it.
2. Why is the DHT11 connected to the ESP32 instead of the Arduino Uno?
As mentioned earlier, if the DHT11 were connected to the Arduino Uno, we would need to send the data to the ESP32 using UART. To keep things simple, I connected it directly to the ESP32, which also has library support for it. It could certainly be done on the Arduino Uno as well.
3. Why choose MQTT?
This communication protocol is lightweight and has less overhead compared to others, making it ideal for IoT scenarios where CPU speed and memory are limited. Of course, this also means its usability is not as robust.
4. Why have two separate databases?
Observant readers might notice that the database for analysis and the app database are separate. This is primarily because I'm less familiar with Prometheus, and querying data myself may take more time. Additionally, Postgres' SQL syntax has more comprehensive integration with node.js, making it easier to write. I might play around with Prometheus queries later!
Results
One of the more well-known air monitoring products online seems to be AWAIR, which offers a beautiful UI and can monitor temperature, humidity, carbon dioxide, as well as chemicals and PM2.5. However, it comes at a hefty price tag of 4,470. In contrast, my implementation cost a total of:
- DHT11 temperature and humidity sensor: approximately NT$60
- MH-Z14A CO2 sensor: approximately NT$800
- ESP32 development board: approximately NT$200
- Arduino Uno: approximately NT$800 (original, using a Nano would be much cheaper)
Total: NT$1,860
Of course, the appearance is quite rudimentary XD, but with a bit of code modification, it could easily be combined with various applications, such as integrating with Google Home or creating a simple mobile app.
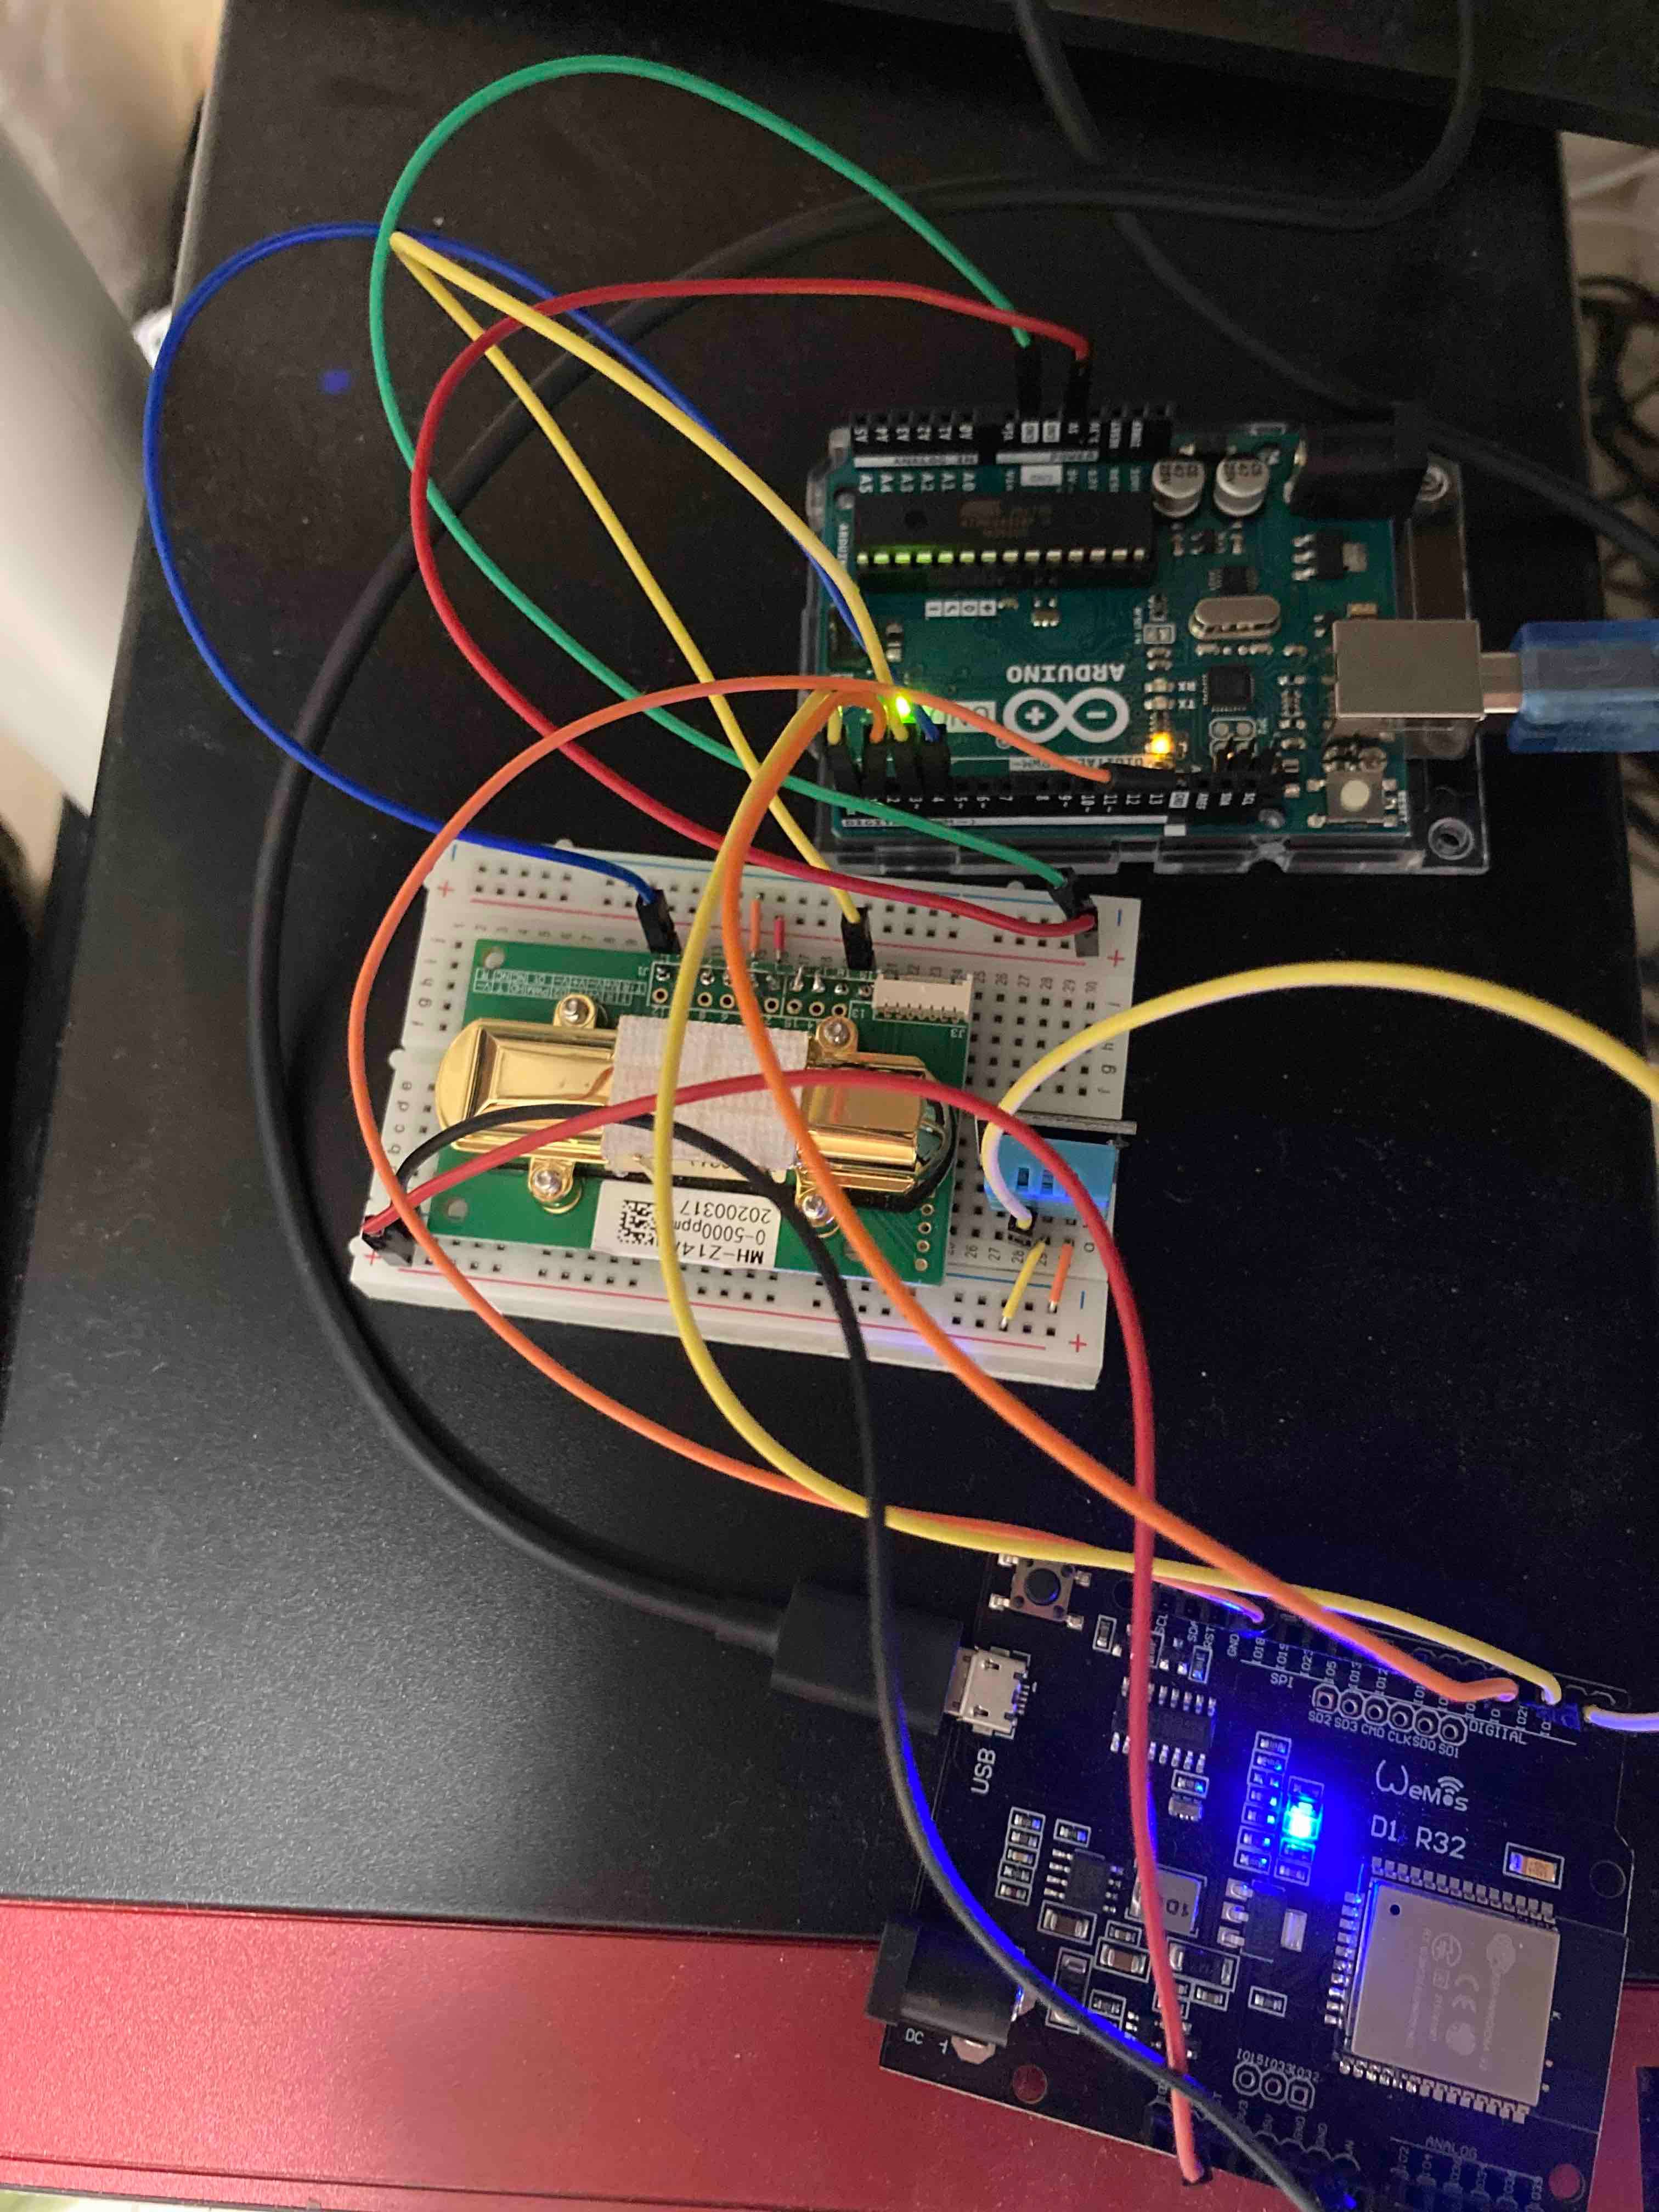
Circuit
With a bit of organization, it can fit into a box quite nicely.
Grafana

Web Interface
The UI is very basic; this is just a demonstration.

Sensor Introduction: DHT11 and MH-Z14A
MH-Z14A CO2 Sensor
To obtain carbon dioxide concentration, we first need a sensor. After a bit of research, I found that a method called NDIR (Non-Dispersive Infrared) can be used to measure CO2 levels.
The principle behind it is that gases absorb specific wavelengths of infrared light, allowing the calculation of gas concentration. For instance, the absorption wavelength range for carbon dioxide is around 4.26μm, so we can compute the concentration based on this wavelength. We won't focus on the calculation formula in this article, but it's worth mentioning how to use this sensor.
I found limited Chinese resources online, so I'll briefly explain it here, referencing the Datasheet. There are many sources for datasheets online, and this one appears to be the most detailed I've seen.
From this datasheet, we can gather several key points:
-
The MH-Z14A communicates via UART, responding after receiving command codes. In addition to measuring carbon dioxide concentration, commands include zero-point calibration and adjusting measurement ranges.
Command Code Function (Original / Translation) Notes 0x86 Gas concentration / 感測二氧化碳濃度 0x87 Calibrate zero point value / 歸零校正 This sensor has three zero-point calibration methods; sending a command is one of them. 0x99 Calibrate span point value / 修改二氧化碳偵測範圍 0x79 Start/stop auto-calibration function of zero point value / 使用(或停止)自動校正功能 This sensor is set to activate auto-calibration by default at the factory. -
The MH-Z14A supports three types of output (super convenient XD):
UART,PWM, and Analog. You can choose the desired output to obtain the carbon dioxide concentration. For this implementation, I chose UART for convenience and to avoid additional digital conversion.
DHT11 Sensor
DHT11 is a temperature and humidity sensor. It is low-power and has a simple construction with only three pins; just connect Vcc and GND to get it started. What’s unique about the DHT11 is its method of transmitting data. Since the DHT11 uses a single pin for the data bus, how does it transmit temperature and humidity data?
The answer is timing. In fact, many hardware communication methods rely on precise time control. For example, to obtain 8 bits of data, you can use a 2ms interval as a unit, reading every 2ms for a total of 16ms to gather the 8 bits.
However, several factors need to be considered to achieve this:
- When does the other party start sending data? In other words, when do we start our 2ms timing?
- How should we handle errors during transmission (such as environmental issues, temporary short circuits, or data loss)?
These aspects are detailed in the datasheet, so let’s take a look.
Single-bus data format is used for communication and synchronization between MCU and DHT11 sensor. One communication process is about 4ms. Data consists of decimal and integral parts. A complete data transmission is 40 bits, with the sensor sending higher data bits first. Data format: 8-bit integral RH data + 8-bit decimal RH data + 8-bit integral T data + 8-bit decimal T data + 8-bit checksum. If the data transmission is correct, the checksum should be the last 8 bits of "8-bit integral RH data + 8-bit decimal RH data + 8-bit integral T data + 8-bit decimal T data."
According to the datasheet, each communication process takes about 4ms, composed of 8-bit relative humidity (integer part) + 8-bit relative humidity (decimal part) + 8-bit temperature (integer part) + 8-bit temperature (decimal part) + 8-bit checksum.
The checksum answers the second question: it is calculated by summing all the data and taking the last 8 bits. (humidity + humidityDec + temp + tempDec != parity)
This way, if the calculated result does not equal the checksum, we can determine that there was an issue during transmission. Of course, it's also possible that transmission issues coincidentally yield the same checksum, but if that happens, we just have to accept it. (Under normal conditions, this probability should be low.)
How does DHT11 transmit data?
To address the first question, we can refer to the diagrams in the datasheet, which describe the entire communication process.

- When beginning to sense temperature (when Arduino requests data from DHT11), it first sends a HIGH -> LOW signal and maintains this for at least 18ms before changing the signal back to LOW -> HIGH. In Arduino code, this can be accomplished using
delay()anddigitalWrite. P.S.: I'm not quite sure why such a long time is needed for DHT11 to detect this signal; I'd appreciate insights from hardware experts. - After 20 microseconds, the MCU will pull the signal back to LOW. (Remember to set the Arduino pin to INPUT; this can be done with
pinMode(PIN, INPUT). ) - The signal should now be LOW, and after waiting 80 microseconds, it will change to HIGH. After another 80 microseconds, it will switch back to LOW.
- The data transmission begins (continuing to the next image).

Finally, data transmission begins! The datasheet explains how to distinguish between 0 and 1. As shown in the diagram, if the voltage remains high for 26-28 microseconds, it represents a 0, while if it stays high for 70 microseconds, it indicates a 1. Each bit is separated by pulling the high voltage low and maintaining it for 50 microseconds before returning to high. This method helps clearly separate each bit's intervals, reducing the chance of misreading by the Arduino.
To calculate these times, you can use micros() in Arduino. A simple implementation could look like this:
void blockUntil(int state)
{
  while (digitalRead(PIN) != state)
  {
  }
}

void main() {
  auto timeS = micros();
  blockUntil(LOW);
  auto timeE = micros();
  auto result = timeE - timeS > 60 ? 1 : 0;
}
Here, I used 60 microseconds instead of the 50 microseconds stated in the datasheet because, at times, reading at exactly 50 microseconds could result in errors. My guess is that when running the code, it gets compiled into machine code, causing the CPU to consume some instruction cycles during execution, which cumulatively leads to the 50 microseconds being inaccurate. However, if that's the case, the 50 microseconds should be adjusted to be smaller rather than larger. So, I wonder if the DHT11 is inherently a bit slow.
After completing the entire process, you should be able to obtain the data! Although this implementation used a library, I plan to write another article on how to achieve the same functionality without one. In reality, as long as you are willing to invest the time to read the datasheet, the implementation should not be too challenging.
Summary
Today, we introduced the sensors and their purposes necessary for this application, reviewed the datasheet, and now you should have a better understanding of how these two sensors transmit data! In the next article, we will discuss common communication channels between hardware - UART - and share the problems encountered during implementation along with the final solutions (which, in reality, just involve using libraries!).
If you found this article helpful, please consider buying me a coffee ☕ It'll make my ordinary day shine ✨
☕Buy me a coffee